Almost two years ago, the California Department of Education revised its accountability system — called the California Dashboard — but opted not to address some of the biggest concerns about the model among district leaders and parent advocates.
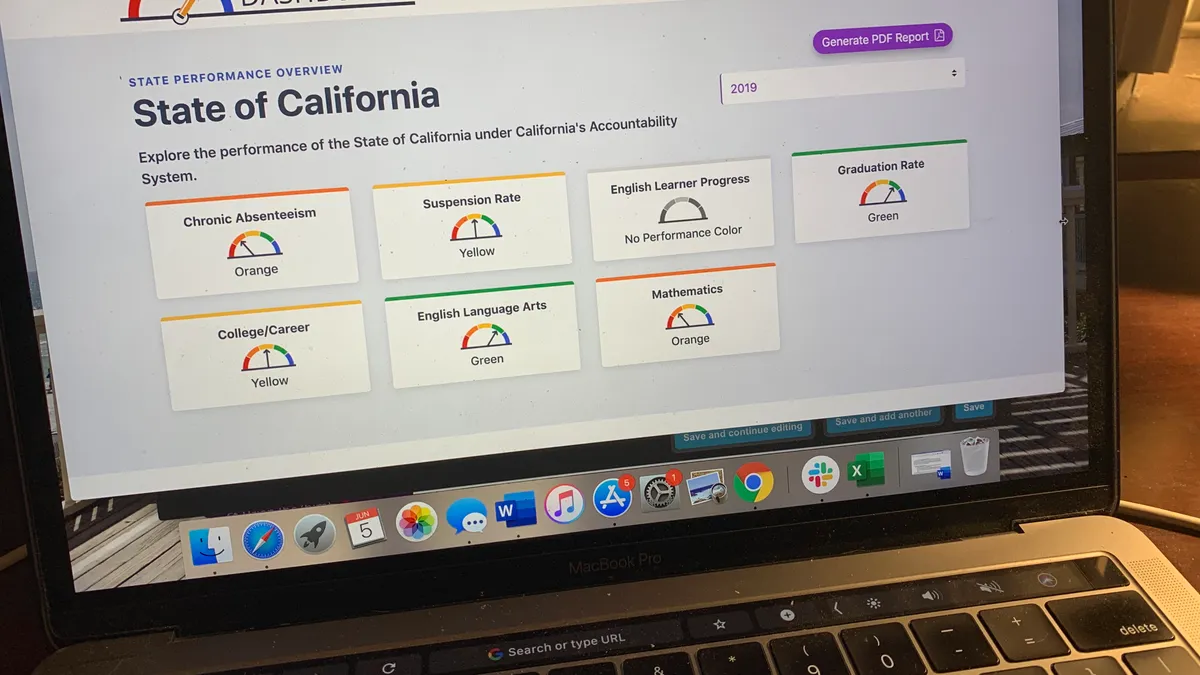
The current system is a color-coded gauge in which the needle ranges from red for the lowest-performing schools, or student subgroups, to blue for the highest-performing. It includes how many points above or below the grade-level “standard” students scored on statewide exams. And it shows whether that school’s scores were higher or lower than the year before.
But critics say the system doesn’t reflect the progress of a particular cohort of students over time, commonly known as a student growth measure. Without a growth model, experts say it’s difficult to determine which schools are doing a great job with students in poverty, those with disabilities, English learners and others who face more challenges.
According to the Data Quality Campaign — which evaluates state K-12 report cards — California and Kansas are the only states that don’t have such an indicator.
“I would say they are right to be frustrated with the way California measures growth,” said Brennan M. Parton, the director of policy and advocacy for the DQC. “It’s not fair to call it a growth measure.”
The California Department of Education, however, is now considering such a model. According to a CDE document, the agency has created a “growth model stakeholder group” and plans to bring the model before the state board this fall.
State Board of Education President Linda Darling-Hammond said discussion of a growth model began under former Gov. Jerry Brown’s administration. And while the idea of adding such an indicator was never rejected, it also “wasn’t ready for prime time,” she said.
Now, “there is a consensus developing,” she said, adding many of the experts who raised concerns about challenges with different techniques “are now working with us.”
Feliza Ortiz-Licon, who served on the state board for five years and is senior director of K-16 education programs at Unidos U.S., said initially there was “huge confusion” among board members on the difference between year-to-year change and growth over time. Once that was resolved, work on a growth model often got pushed aside because there were other dashboard-related issues that required attention.
In March, several advocacy and nonprofit groups sent a letter to Darling-Hammond, asking that board members prioritize adding a growth model to the dashboard.
“Schools, teachers and stakeholders have waited two decades for such a model, and it is long overdue,” they wrote. “Because the cornerstone of public education is to equitably promote increased student learning for all students every school year, including a growth measure on the dashboard is a transparent and more accurate approach to reflect students’ progress in each school and district.”
Adding a growth model, Parton said, would bring California “up to date with the 49 other states that chose a student-level growth measure as one way to understand whether schools are equitably serving their students.” She is including the District of Columbia.
As far as Kansas is concerned, Ann Bush, a communications specialist for the Kansas State Department of Education, said “Student growth is not part of Kansas’ approved [Every Student Succeeds Act] plan. At this time, Kansas is not planning to revise our ESSA plan to add a growth measure.”
Which schools ‘beat the odds?’
Parton and Chad Aldeman, a senior associate partner at Bellwether Education Partners, wrote in a recent article that student growth data will be especially important as a result of missing a year of state assessment results because of the pandemic.
Following student progress over time allows districts and officials to “look at the schools that beat the odds in this crisis” and to evaluate how schools “served the groups of kids that we thought were going to suffer the most.”
Seth Litt, executive director of Parent Revolution, a Los Angeles advocacy organization that supports the use of growth data, agreed.
“When the next school year starts, we are facing a reality that many students will have fallen behind. We’ve seen COVID-19 exacerbate existing inequities, having disproportionate impacts on communities of color,” he said. “It’s critical that students, especially from impacted communities, have access to schools that can effectively meet their needs, and that school systems understand which schools these are and that they know how to support them and grow the practices that make them great places for students.”
The measure California is considering is called a residual gain model. It’s one Morgan Polikoff, an associate professor of education at the University of Southern California, wrote about in a document last fall addressing misconceptions in the state about growth measures.
A residual gain model, he explained, uses a student’s test scores to predict what the same student would score the following year. The system then determines how far above or below the prediction students score and uses that result to determine a school’s effectiveness.
“In other words,” he said, “a school where kids consistently outperform what you’d expect is a school that is effective, and a school where kids consistently under perform is a school that is ineffective.”
Polikoff added he would “strongly advocate” CDE replace its change indicator — which compares different groups of students — with a growth measure.
High-poverty schools also tend to have higher student mobility rates, which makes “the state’s ‘change’ calculation less accurate” than it is in low-poverty schools, added Paul Warren, a research associate with the Public Policy Institute of California and a former deputy director at the CDE.
The Los Angeles Unified School District’s new “academic growth” score is similar to what the state is considering, as is the model used in the eight CORE districts in the state, which includes LAUSD.
Parton added California’s “speedometer” tool is presented without a lot of context and, she said, "a place to start would be language explaining what we’re looking at."
She holds up Idaho’s School Finder report card as one good example of using a growth model, in addition to student achievement results, and then communicating to users what the data means.
Concerns over punishing schools
Parton added there is value in “comparing the performance of two different cohorts,” but the only way to measure how effective a school is at teaching the students who enter their schools is through measuring “individual students’ learning progress over time.”
Barbara Nemko, superintendent of the Napa County Office of Education — which includes five districts — said only measuring achievement is unfair to schools serving students with greater needs.
“We have always known that there was a positive correlation between socioeconomic status and how kids score on tests,” she said. “We punish schools if their population is low SES and we call them failing schools.”
Lexi Lopez, the daughter of a teacher and the communications director for advocacy organization EdVoice — one of the groups signing the letter to Darling-Hammond — explained how the current dashboard fails to capture what’s actually happening to student performance.
Two schools can appear on the dashboard to be performing at the same level. But in one school, she said, 5th-graders who were scoring at a 2nd-grade level increased to a 4th-grade level, for example. And in another school, students who were already meeting the standard stayed at the same level.
“If you look at the dashboard [for the first school], it’s still going to look red because they are still not at grade level,” Lopez said. “You can have schools that are really kicking it out of the park, but they’re not getting the credit that they really deserve.”
Nemko added teachers with students who come from “professional families don’t have to work as hard,” while those teaching the neediest students “are killing themselves” to improve achievement.
But both Darling-Hammond and Ortiz-Licon noted there are still challenges with growth models. First, growth is most noticeable at lower ends of the achievement scale and less so for top-performing students, Darling-Hammond said. Because the Every Student Succeeds Act requires states to measure performance against a grade-level standard, schools in which most students have already met the standard won’t appear to be improving.
“You have to be sure you’re not penalizing Palo Alto [for example] for having a lot of kids at the top,” she said. “The idea of a growth model is simple. The fact of a growth model is complicated.”
Student mobility is also a factor under a growth model, Darling-Hammond added. How should a system treat schools with high transiency rates that only teach students for part of a school year?
And, Ortiz-Licon noted, how would a growth model apply to the state’s science assessment, which students only take three times across their K-12 years?
Finally, growth measures will be useful in determining how successful schools were despite school closures. But the standardized tests used in those models, Darling-Hammond said, aren’t designed to guide instruction and answer how much learning students lost — the biggest concern for most educators and parents right now.
“We won’t meet every desire that everybody has for every tool,” she said.
Questions about English learners
Still, identifying which schools are successful with students of color, those from low-income families or those with more complex needs, such as homelessness or living in foster care, can help district and school leaders learn from each other.
That’s what the Learning Policy Institute, the think tank Darling-Hammond leads, aimed to do last year with its its "positive outliers" report — which highlighted the work of California districts in which students are earning higher-than-predicted English language arts and math scores on state assessments — after taking socioeconomic status into consideration.
A related concern for Lopez has been a lack of data on English learners, who make up more than 19% of the state’s 6.1 million students. Some reports suggest ELs are among the students whose learning has been most affected by school closures.
On the dashboard summary, the “English Learner Progress” box appears in gray and reads “no performance color.”
That, Lopez said, “demonstrates the state has very little confidence in the subgroup data being comparable enough to put in the color-coded dashboard format.” Users can click on the box and get additional data, but she added “parents and even other relatively sophisticated internet users are not likely to click on a gray icon.”
The state has been transitioning to a new test that tracks students’ progress toward learning English — the English Language Proficiency Assessments for California. So, while a deeper look provides the percentage of students making progress, the state needs three years of data to show change and color on the gauge, according to CDE. Those results will begin to appear on the 2021 dashboard.
Oritz-Licon also noted some parents looking at overall school performance are unlikely to realize English learners or those who have been “reclassified” as fluent could be doing much worse. Having a growth model, she said, would be an opportunity to look at how schools are serving students at different points in English language development — a point she made during her last meeting on the board in January.
Such data can also help parents make more informed choices, Lopez said.
“If you have a child that is struggling, you really want to find a school that can help them get back on track the fastest,” she said. “At the end of the day, what we’re all here for is that every student reaches his or her full potential.”


